Split View: OpenTelemetry Collector 파이프라인 설계 실전 가이드 — Receiver, Processor, Exporter
OpenTelemetry Collector 파이프라인 설계 실전 가이드 — Receiver, Processor, Exporter
들어가며
마이크로서비스 환경에서 Traces, Metrics, Logs를 통합 수집하고 처리하는 것은 Observability의 핵심입니다. OpenTelemetry Collector는 벤더 중립적인 텔레메트리 파이프라인으로, 다양한 소스에서 데이터를 수집하고 원하는 백엔드로 전송합니다.
이 글에서는 OTel Collector의 아키텍처를 이해하고, 프로덕션 환경에서의 파이프라인 설계를 다룹니다.
OTel Collector 아키텍처
파이프라인 구조
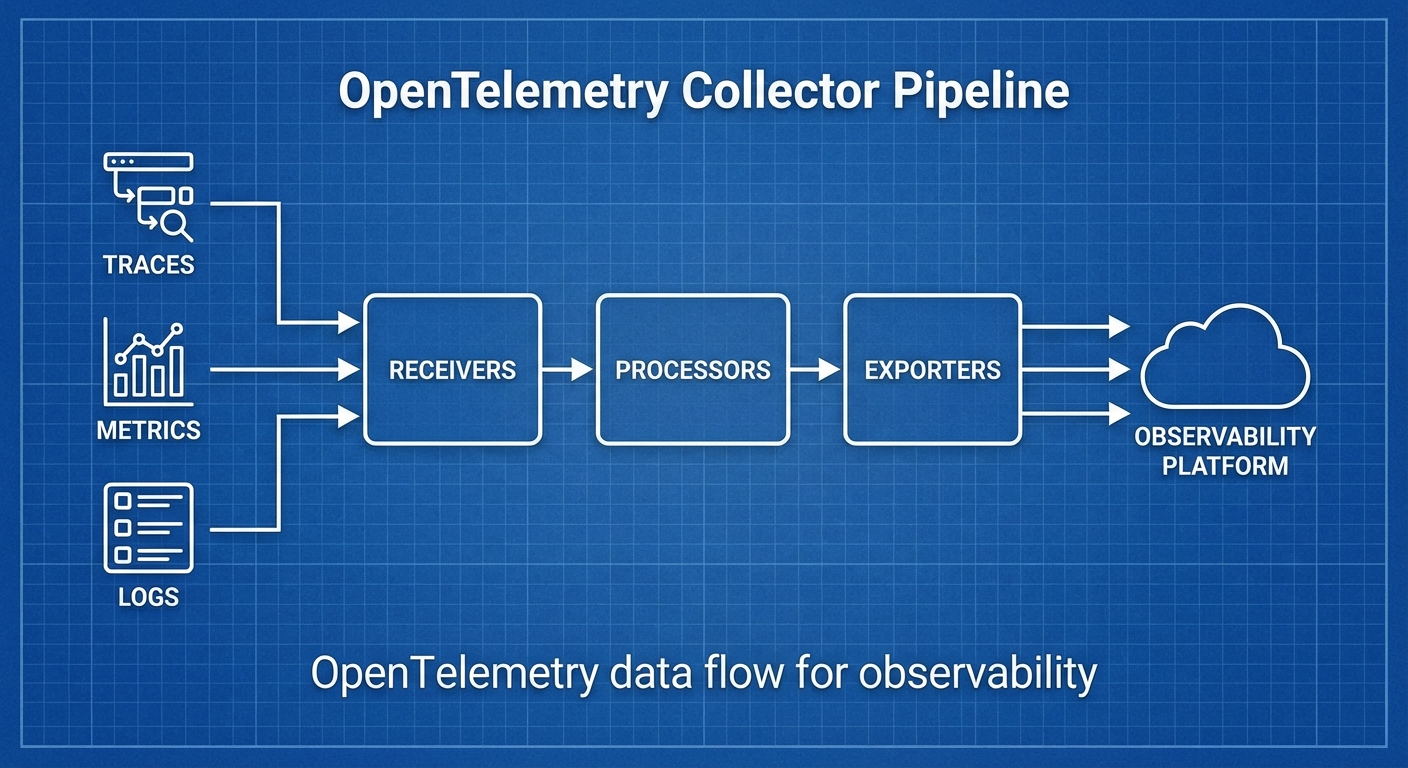
# 데이터 흐름
# Receiver → Processor → Exporter
#
# Receiver: 데이터 수집 (OTLP, Jaeger, Prometheus, Fluentd 등)
# Processor: 데이터 가공 (필터링, 변환, 배칭, 샘플링)
# Exporter: 데이터 전송 (OTLP, Jaeger, Prometheus, Loki 등)
#
# 하나의 Collector에 여러 파이프라인 구성 가능:
# - traces pipeline
# - metrics pipeline
# - logs pipeline
Collector 배포 패턴
# 패턴 1: Agent (사이드카/데몬셋)
# 각 노드/Pod에 배치, 로컬 수집

# 패턴 2: Gateway (중앙 집중)
# 클러스터 내 독립 서비스로 배치, 트래픽 집중

# 패턴 3: Agent + Gateway (권장)
# Agent가 로컬 수집 → Gateway가 중앙 처리/라우팅
설치
Kubernetes (Helm)
# OpenTelemetry Operator 설치
helm repo add open-telemetry https://open-telemetry.github.io/opentelemetry-helm-charts
helm repo update

# Collector 설치 (DaemonSet 모드)
helm install otel-collector open-telemetry/opentelemetry-collector \
  --namespace observability \
  --create-namespace \
  --values collector-values.yaml
Docker
docker run -d --name otel-collector \
  -p 4317:4317 \
  -p 4318:4318 \
  -p 8888:8888 \
  -v $(pwd)/otel-collector-config.yaml:/etc/otelcol/config.yaml \
  otel/opentelemetry-collector-contrib:0.96.0
파이프라인 설정
기본 설정 구조
# otel-collector-config.yaml
receivers:
  otlp:
    protocols:
      grpc:
        endpoint: 0.0.0.0:4317
      http:
        endpoint: 0.0.0.0:4318

processors:
  batch:
    timeout: 5s
    send_batch_size: 1000
    send_batch_max_size: 1500

exporters:
  debug:
    verbosity: detailed

service:
  pipelines:
    traces:
      receivers: [otlp]
      processors: [batch]
      exporters: [debug]
    metrics:
      receivers: [otlp]
      processors: [batch]
      exporters: [debug]
    logs:
      receivers: [otlp]
      processors: [batch]
      exporters: [debug]
프로덕션 파이프라인
# production-config.yaml
receivers:
  # OTLP (애플리케이션 SDK에서 전송)
  otlp:
    protocols:
      grpc:
        endpoint: 0.0.0.0:4317
        max_recv_msg_size_mib: 4
      http:
        endpoint: 0.0.0.0:4318
        cors:
          allowed_origins: ['*']

  # Prometheus 스크래핑
  prometheus:
    config:
      scrape_configs:
        - job_name: 'kubernetes-pods'
          kubernetes_sd_configs:
            - role: pod
          relabel_configs:
            - source_labels: [__meta_kubernetes_pod_annotation_prometheus_io_scrape]
              action: keep
              regex: true

  # 호스트 메트릭
  hostmetrics:
    collection_interval: 30s
    scrapers:
      cpu: {}
      memory: {}
      disk: {}
      network: {}
      load: {}

  # Kubernetes 이벤트
  k8s_events:
    namespaces: [default, production]

processors:
  # 배칭
  batch:
    timeout: 5s
    send_batch_size: 1000

  # 메모리 제한
  memory_limiter:
    check_interval: 1s
    limit_mib: 1500
    spike_limit_mib: 512

  # 리소스 정보 추가
  resourcedetection:
    detectors: [env, system, docker, gcp, aws, azure]
    timeout: 5s

  # K8s 메타데이터 추가
  k8sattributes:
    auth_type: serviceAccount
    extract:
      metadata:
        - k8s.namespace.name
        - k8s.deployment.name
        - k8s.pod.name
        - k8s.node.name

  # 불필요한 속성 제거
  attributes:
    actions:
      - key: http.request.header.authorization
        action: delete
      - key: db.statement
        action: hash # 민감 쿼리 해싱

  # 테일 샘플링 (traces만)
  tail_sampling:
    decision_wait: 10s
    num_traces: 100000
    policies:
      - name: error-policy
        type: status_code
        status_code:
          status_codes: [ERROR]
      - name: slow-policy
        type: latency
        latency:
          threshold_ms: 1000
      - name: probabilistic-policy
        type: probabilistic
        probabilistic:
          sampling_percentage: 10

  # 필터링
  filter:
    metrics:
      exclude:
        match_type: regexp
        metric_names:
          - 'go_.*'
          - 'process_.*'

exporters:
  # Traces → Tempo
  otlp/tempo:
    endpoint: tempo.observability.svc:4317
    tls:
      insecure: true

  # Metrics → Prometheus/Mimir
  prometheusremotewrite:
    endpoint: http://mimir.observability.svc:9009/api/v1/push
    tls:
      insecure: true
    resource_to_telemetry_conversion:
      enabled: true

  # Logs → Loki
  loki:
    endpoint: http://loki.observability.svc:3100/loki/api/v1/push
    default_labels_enabled:
      exporter: true
      job: true

  # 디버그 (문제 해결용)
  debug:
    verbosity: basic

extensions:
  # 헬스체크
  health_check:
    endpoint: 0.0.0.0:13133

  # 자체 메트릭
  zpages:
    endpoint: 0.0.0.0:55679

  # pprof (프로파일링)
  pprof:
    endpoint: 0.0.0.0:1777

service:
  extensions: [health_check, zpages, pprof]

  pipelines:
    traces:
      receivers: [otlp]
      processors:
        [memory_limiter, resourcedetection, k8sattributes, attributes, tail_sampling, batch]
      exporters: [otlp/tempo]

    metrics:
      receivers: [otlp, prometheus, hostmetrics]
      processors: [memory_limiter, resourcedetection, k8sattributes, filter, batch]
      exporters: [prometheusremotewrite]

    logs:
      receivers: [otlp, k8s_events]
      processors: [memory_limiter, resourcedetection, k8sattributes, attributes, batch]
      exporters: [loki]

  telemetry:
    logs:
      level: info
    metrics:
      address: 0.0.0.0:8888
Receiver 상세
OTLP Receiver
receivers:
  otlp:
    protocols:
      grpc:
        endpoint: 0.0.0.0:4317
        max_recv_msg_size_mib: 4
        keepalive:
          server_parameters:
            max_connection_idle: 11s
            max_connection_age: 30s
      http:
        endpoint: 0.0.0.0:4318
Filelog Receiver (로그 파일 수집)
receivers:
  filelog:
    include:
      - /var/log/pods/*/*/*.log
    exclude:
      - /var/log/pods/*/otel-collector*/*.log
    start_at: beginning
    include_file_path: true
    operators:
      - type: router
        routes:
          - output: parse_json
            expr: 'body matches "^\\{"'
          - output: parse_plain
            expr: 'body matches "^[^{]"'
      - id: parse_json
        type: json_parser
        timestamp:
          parse_from: attributes.timestamp
          layout: '%Y-%m-%dT%H:%M:%S.%fZ'
      - id: parse_plain
        type: regex_parser
        regex: '^(?P<timestamp>\S+) (?P<level>\S+) (?P<message>.*)'
Processor 상세
Tail Sampling (핵심!)
processors:
  tail_sampling:
    decision_wait: 10s
    num_traces: 100000
    expected_new_traces_per_sec: 1000
    policies:
      # 에러는 100% 수집
      - name: errors
        type: status_code
        status_code:
          status_codes: [ERROR]

      # 1초 이상 느린 요청은 100% 수집
      - name: slow-traces
        type: latency
        latency:
          threshold_ms: 1000

      # 특정 서비스는 100% 수집
      - name: critical-services
        type: string_attribute
        string_attribute:
          key: service.name
          values: [payment-service, auth-service]

      # 나머지는 5%만 수집
      - name: probabilistic
        type: probabilistic
        probabilistic:
          sampling_percentage: 5

      # 복합 정책
      - name: composite-policy
        type: composite
        composite:
          max_total_spans_per_second: 1000
          policy_order: [errors, slow-traces, critical-services, probabilistic]
          rate_allocation:
            - policy: errors
              percent: 30
            - policy: slow-traces
              percent: 30
            - policy: critical-services
              percent: 20
            - policy: probabilistic
              percent: 20
Transform Processor
processors:
  transform:
    trace_statements:
      - context: span
        statements:
          # 속성 추가
          - set(attributes["deployment.environment"], "production")
          # 속성 변환
          - replace_pattern(attributes["http.url"], "password=\\w+", "password=***")
          # 조건부 처리
          - set(attributes["error.category"], "timeout") where attributes["error.type"] == "DeadlineExceeded"

    metric_statements:
      - context: datapoint
        statements:
          - set(attributes["env"], "prod")

    log_statements:
      - context: log
        statements:
          # 로그 본문에서 정보 추출
          - set(attributes["user_id"], ExtractPatterns(body, "user_id=(?P<user_id>\\w+)"))
Kubernetes 배포
Agent (DaemonSet) + Gateway 패턴
# agent-config.yaml (DaemonSet)
apiVersion: opentelemetry.io/v1beta1
kind: OpenTelemetryCollector
metadata:
  name: otel-agent
  namespace: observability
spec:
  mode: daemonset
  config:
    receivers:
      otlp:
        protocols:
          grpc:
            endpoint: 0.0.0.0:4317
      hostmetrics:
        collection_interval: 30s
        scrapers:
          cpu: {}
          memory: {}

    processors:
      memory_limiter:
        limit_mib: 512
      batch:
        timeout: 5s

    exporters:
      # Gateway로 전송
      otlp:
        endpoint: otel-gateway.observability.svc:4317
        tls:
          insecure: true

    service:
      pipelines:
        traces:
          receivers: [otlp]
          processors: [memory_limiter, batch]
          exporters: [otlp]
        metrics:
          receivers: [otlp, hostmetrics]
          processors: [memory_limiter, batch]
          exporters: [otlp]
---
# gateway-config.yaml (Deployment)
apiVersion: opentelemetry.io/v1beta1
kind: OpenTelemetryCollector
metadata:
  name: otel-gateway
  namespace: observability
spec:
  mode: deployment
  replicas: 3
  config:
    receivers:
      otlp:
        protocols:
          grpc:
            endpoint: 0.0.0.0:4317

    processors:
      memory_limiter:
        limit_mib: 2048
      tail_sampling:
        decision_wait: 10s
        policies:
          - name: errors
            type: status_code
            status_code:
              status_codes: [ERROR]
          - name: probabilistic
            type: probabilistic
            probabilistic:
              sampling_percentage: 10
      batch:
        timeout: 10s
        send_batch_size: 5000

    exporters:
      otlp/tempo:
        endpoint: tempo.observability.svc:4317
        tls:
          insecure: true
      prometheusremotewrite:
        endpoint: http://mimir.observability.svc:9009/api/v1/push
      loki:
        endpoint: http://loki.observability.svc:3100/loki/api/v1/push

    service:
      pipelines:
        traces:
          receivers: [otlp]
          processors: [memory_limiter, tail_sampling, batch]
          exporters: [otlp/tempo]
        metrics:
          receivers: [otlp]
          processors: [memory_limiter, batch]
          exporters: [prometheusremotewrite]
        logs:
          receivers: [otlp]
          processors: [memory_limiter, batch]
          exporters: [loki]
트러블슈팅
자체 메트릭 확인
# Collector 자체 메트릭 (port 8888)
curl http://localhost:8888/metrics | grep otelcol

# 주요 메트릭:
# otelcol_receiver_accepted_spans - 수신된 span 수
# otelcol_receiver_refused_spans - 거부된 span 수
# otelcol_processor_dropped_spans - 드롭된 span 수
# otelcol_exporter_sent_spans - 전송된 span 수
# otelcol_exporter_send_failed_spans - 전송 실패 span 수
zPages로 디버깅
# http://localhost:55679/debug/tracez — 최근 trace 확인
# http://localhost:55679/debug/pipelinez — 파이프라인 상태
마무리
OpenTelemetry Collector 파이프라인 설계의 핵심:
- Agent + Gateway 패턴: 로컬 수집 + 중앙 처리로 효율적 운영
- Tail Sampling: 에러/느린 요청 100%, 나머지 확률 샘플링으로 비용 절감
- Memory Limiter 필수: OOM 방지를 위한 메모리 제한
- Processor 순서 중요: memory_limiter → sampling → batch 순서 권장
- 벤더 중립: 백엔드 변경 시 Exporter만 교체
📝 퀴즈 (6문제)
Q1. OTel Collector 파이프라인의 세 가지 구성 요소는? Receiver, Processor, Exporter
Q2. Agent + Gateway 패턴에서 각각의 역할은? Agent: 각 노드에서 로컬 수집, Gateway: 중앙에서 처리/라우팅/전송
Q3. Tail Sampling이 Head Sampling보다 나은 이유는? 전체 trace를 본 후 샘플링 결정하므로 에러/느린 요청을 놓치지 않음
Q4. memory_limiter Processor를 파이프라인 첫 번째에 두는 이유는? 수신 데이터가 많을 때 OOM을 방지하기 위해 가장 먼저 메모리를 체크
Q5. Collector의 자체 메트릭을 확인하는 방법은? port 8888의 /metrics 엔드포인트 또는 zPages (port 55679)
Q6. batch Processor의 timeout과 send_batch_size의 관계는? timeout 시간이 되거나 send_batch_size에 도달하면 배치를 전송 (먼저 발생하는 조건)
OpenTelemetry Collector Pipeline Design Practical Guide — Receiver, Processor, Exporter
- Introduction
- OTel Collector Architecture
- Installation
- Pipeline Configuration
- Receiver Details
- Processor Details
- Kubernetes Deployment
- Troubleshooting
- Conclusion
- Quiz
Introduction
In microservice environments, unified collection and processing of Traces, Metrics, and Logs is at the core of Observability. The OpenTelemetry Collector is a vendor-neutral telemetry pipeline that collects data from various sources and sends it to the desired backends.
In this article, we explore the OTel Collector architecture and cover pipeline design for production environments.
OTel Collector Architecture
Pipeline Structure
# Data Flow
# Receiver → Processor → Exporter
#
# Receiver: Data collection (OTLP, Jaeger, Prometheus, Fluentd, etc.)
# Processor: Data processing (filtering, transformation, batching, sampling)
# Exporter: Data transmission (OTLP, Jaeger, Prometheus, Loki, etc.)
#
# Multiple pipelines can be configured in a single Collector:
# - traces pipeline
# - metrics pipeline
# - logs pipeline
Collector Deployment Patterns
# Pattern 1: Agent (Sidecar/DaemonSet)
# Deployed on each node/Pod, collects locally

# Pattern 2: Gateway (Centralized)
# Deployed as an independent service in the cluster, centralizes traffic

# Pattern 3: Agent + Gateway (Recommended)
# Agent collects locally → Gateway handles central processing/routing
Installation
Kubernetes (Helm)
# Install OpenTelemetry Operator
helm repo add open-telemetry https://open-telemetry.github.io/opentelemetry-helm-charts
helm repo update

# Install Collector (DaemonSet mode)
helm install otel-collector open-telemetry/opentelemetry-collector \
  --namespace observability \
  --create-namespace \
  --values collector-values.yaml
Docker
docker run -d --name otel-collector \
  -p 4317:4317 \
  -p 4318:4318 \
  -p 8888:8888 \
  -v $(pwd)/otel-collector-config.yaml:/etc/otelcol/config.yaml \
  otel/opentelemetry-collector-contrib:0.96.0
Pipeline Configuration
Basic Configuration Structure
# otel-collector-config.yaml
receivers:
  otlp:
    protocols:
      grpc:
        endpoint: 0.0.0.0:4317
      http:
        endpoint: 0.0.0.0:4318

processors:
  batch:
    timeout: 5s
    send_batch_size: 1000
    send_batch_max_size: 1500

exporters:
  debug:
    verbosity: detailed

service:
  pipelines:
    traces:
      receivers: [otlp]
      processors: [batch]
      exporters: [debug]
    metrics:
      receivers: [otlp]
      processors: [batch]
      exporters: [debug]
    logs:
      receivers: [otlp]
      processors: [batch]
      exporters: [debug]
Production Pipeline
# production-config.yaml
receivers:
  # OTLP (sent from application SDKs)
  otlp:
    protocols:
      grpc:
        endpoint: 0.0.0.0:4317
        max_recv_msg_size_mib: 4
      http:
        endpoint: 0.0.0.0:4318
        cors:
          allowed_origins: ['*']

  # Prometheus scraping
  prometheus:
    config:
      scrape_configs:
        - job_name: 'kubernetes-pods'
          kubernetes_sd_configs:
            - role: pod
          relabel_configs:
            - source_labels: [__meta_kubernetes_pod_annotation_prometheus_io_scrape]
              action: keep
              regex: true

  # Host metrics
  hostmetrics:
    collection_interval: 30s
    scrapers:
      cpu: {}
      memory: {}
      disk: {}
      network: {}
      load: {}

  # Kubernetes events
  k8s_events:
    namespaces: [default, production]

processors:
  # Batching
  batch:
    timeout: 5s
    send_batch_size: 1000

  # Memory limiting
  memory_limiter:
    check_interval: 1s
    limit_mib: 1500
    spike_limit_mib: 512

  # Resource information enrichment
  resourcedetection:
    detectors: [env, system, docker, gcp, aws, azure]
    timeout: 5s

  # K8s metadata enrichment
  k8sattributes:
    auth_type: serviceAccount
    extract:
      metadata:
        - k8s.namespace.name
        - k8s.deployment.name
        - k8s.pod.name
        - k8s.node.name

  # Remove unnecessary attributes
  attributes:
    actions:
      - key: http.request.header.authorization
        action: delete
      - key: db.statement
        action: hash # Hash sensitive queries

  # Tail sampling (traces only)
  tail_sampling:
    decision_wait: 10s
    num_traces: 100000
    policies:
      - name: error-policy
        type: status_code
        status_code:
          status_codes: [ERROR]
      - name: slow-policy
        type: latency
        latency:
          threshold_ms: 1000
      - name: probabilistic-policy
        type: probabilistic
        probabilistic:
          sampling_percentage: 10

  # Filtering
  filter:
    metrics:
      exclude:
        match_type: regexp
        metric_names:
          - 'go_.*'
          - 'process_.*'

exporters:
  # Traces → Tempo
  otlp/tempo:
    endpoint: tempo.observability.svc:4317
    tls:
      insecure: true

  # Metrics → Prometheus/Mimir
  prometheusremotewrite:
    endpoint: http://mimir.observability.svc:9009/api/v1/push
    tls:
      insecure: true
    resource_to_telemetry_conversion:
      enabled: true

  # Logs → Loki
  loki:
    endpoint: http://loki.observability.svc:3100/loki/api/v1/push
    default_labels_enabled:
      exporter: true
      job: true

  # Debug (for troubleshooting)
  debug:
    verbosity: basic

extensions:
  # Health check
  health_check:
    endpoint: 0.0.0.0:13133

  # Self metrics
  zpages:
    endpoint: 0.0.0.0:55679

  # pprof (profiling)
  pprof:
    endpoint: 0.0.0.0:1777

service:
  extensions: [health_check, zpages, pprof]

  pipelines:
    traces:
      receivers: [otlp]
      processors:
        [memory_limiter, resourcedetection, k8sattributes, attributes, tail_sampling, batch]
      exporters: [otlp/tempo]

    metrics:
      receivers: [otlp, prometheus, hostmetrics]
      processors: [memory_limiter, resourcedetection, k8sattributes, filter, batch]
      exporters: [prometheusremotewrite]

    logs:
      receivers: [otlp, k8s_events]
      processors: [memory_limiter, resourcedetection, k8sattributes, attributes, batch]
      exporters: [loki]

  telemetry:
    logs:
      level: info
    metrics:
      address: 0.0.0.0:8888
Receiver Details
OTLP Receiver
receivers:
  otlp:
    protocols:
      grpc:
        endpoint: 0.0.0.0:4317
        max_recv_msg_size_mib: 4
        keepalive:
          server_parameters:
            max_connection_idle: 11s
            max_connection_age: 30s
      http:
        endpoint: 0.0.0.0:4318
Filelog Receiver (Log File Collection)
receivers:
  filelog:
    include:
      - /var/log/pods/*/*/*.log
    exclude:
      - /var/log/pods/*/otel-collector*/*.log
    start_at: beginning
    include_file_path: true
    operators:
      - type: router
        routes:
          - output: parse_json
            expr: 'body matches "^\\{"'
          - output: parse_plain
            expr: 'body matches "^[^{]"'
      - id: parse_json
        type: json_parser
        timestamp:
          parse_from: attributes.timestamp
          layout: '%Y-%m-%dT%H:%M:%S.%fZ'
      - id: parse_plain
        type: regex_parser
        regex: '^(?P<timestamp>\S+) (?P<level>\S+) (?P<message>.*)'
Processor Details
Tail Sampling (Critical!)
processors:
  tail_sampling:
    decision_wait: 10s
    num_traces: 100000
    expected_new_traces_per_sec: 1000
    policies:
      # Collect 100% of errors
      - name: errors
        type: status_code
        status_code:
          status_codes: [ERROR]

      # Collect 100% of slow requests over 1 second
      - name: slow-traces
        type: latency
        latency:
          threshold_ms: 1000

      # Collect 100% for specific services
      - name: critical-services
        type: string_attribute
        string_attribute:
          key: service.name
          values: [payment-service, auth-service]

      # Collect only 5% of the rest
      - name: probabilistic
        type: probabilistic
        probabilistic:
          sampling_percentage: 5

      # Composite policy
      - name: composite-policy
        type: composite
        composite:
          max_total_spans_per_second: 1000
          policy_order: [errors, slow-traces, critical-services, probabilistic]
          rate_allocation:
            - policy: errors
              percent: 30
            - policy: slow-traces
              percent: 30
            - policy: critical-services
              percent: 20
            - policy: probabilistic
              percent: 20
Transform Processor
processors:
  transform:
    trace_statements:
      - context: span
        statements:
          # Add attribute
          - set(attributes["deployment.environment"], "production")
          # Transform attribute
          - replace_pattern(attributes["http.url"], "password=\\w+", "password=***")
          # Conditional processing
          - set(attributes["error.category"], "timeout") where attributes["error.type"] == "DeadlineExceeded"

    metric_statements:
      - context: datapoint
        statements:
          - set(attributes["env"], "prod")

    log_statements:
      - context: log
        statements:
          # Extract information from log body
          - set(attributes["user_id"], ExtractPatterns(body, "user_id=(?P<user_id>\\w+)"))
Kubernetes Deployment
Agent (DaemonSet) + Gateway Pattern
# agent-config.yaml (DaemonSet)
apiVersion: opentelemetry.io/v1beta1
kind: OpenTelemetryCollector
metadata:
  name: otel-agent
  namespace: observability
spec:
  mode: daemonset
  config:
    receivers:
      otlp:
        protocols:
          grpc:
            endpoint: 0.0.0.0:4317
      hostmetrics:
        collection_interval: 30s
        scrapers:
          cpu: {}
          memory: {}

    processors:
      memory_limiter:
        limit_mib: 512
      batch:
        timeout: 5s

    exporters:
      # Send to Gateway
      otlp:
        endpoint: otel-gateway.observability.svc:4317
        tls:
          insecure: true

    service:
      pipelines:
        traces:
          receivers: [otlp]
          processors: [memory_limiter, batch]
          exporters: [otlp]
        metrics:
          receivers: [otlp, hostmetrics]
          processors: [memory_limiter, batch]
          exporters: [otlp]
---
# gateway-config.yaml (Deployment)
apiVersion: opentelemetry.io/v1beta1
kind: OpenTelemetryCollector
metadata:
  name: otel-gateway
  namespace: observability
spec:
  mode: deployment
  replicas: 3
  config:
    receivers:
      otlp:
        protocols:
          grpc:
            endpoint: 0.0.0.0:4317

    processors:
      memory_limiter:
        limit_mib: 2048
      tail_sampling:
        decision_wait: 10s
        policies:
          - name: errors
            type: status_code
            status_code:
              status_codes: [ERROR]
          - name: probabilistic
            type: probabilistic
            probabilistic:
              sampling_percentage: 10
      batch:
        timeout: 10s
        send_batch_size: 5000

    exporters:
      otlp/tempo:
        endpoint: tempo.observability.svc:4317
        tls:
          insecure: true
      prometheusremotewrite:
        endpoint: http://mimir.observability.svc:9009/api/v1/push
      loki:
        endpoint: http://loki.observability.svc:3100/loki/api/v1/push

    service:
      pipelines:
        traces:
          receivers: [otlp]
          processors: [memory_limiter, tail_sampling, batch]
          exporters: [otlp/tempo]
        metrics:
          receivers: [otlp]
          processors: [memory_limiter, batch]
          exporters: [prometheusremotewrite]
        logs:
          receivers: [otlp]
          processors: [memory_limiter, batch]
          exporters: [loki]
Troubleshooting
Checking Self Metrics
# Collector self metrics (port 8888)
curl http://localhost:8888/metrics | grep otelcol

# Key metrics:
# otelcol_receiver_accepted_spans - Number of accepted spans
# otelcol_receiver_refused_spans - Number of refused spans
# otelcol_processor_dropped_spans - Number of dropped spans
# otelcol_exporter_sent_spans - Number of sent spans
# otelcol_exporter_send_failed_spans - Number of failed spans
Debugging with zPages
# http://localhost:55679/debug/tracez — View recent traces
# http://localhost:55679/debug/pipelinez — View pipeline status
Conclusion
Key points for OpenTelemetry Collector pipeline design:
- Agent + Gateway pattern: Efficient operations with local collection + centralized processing
- Tail Sampling: Cost reduction with 100% collection for errors/slow requests, probabilistic sampling for the rest
- Memory Limiter is essential: Memory limits to prevent OOM
- Processor order matters: Recommended order is memory_limiter then sampling then batch
- Vendor neutral: Only swap the Exporter when changing backends
Quiz (6 Questions)
Q1. What are the three components of an OTel Collector pipeline? Receiver, Processor, Exporter
Q2. What are the roles of Agent and Gateway in the Agent + Gateway pattern? Agent: Local collection on each node, Gateway: Central processing/routing/transmission
Q3. Why is Tail Sampling better than Head Sampling? It makes sampling decisions after seeing the complete trace, so errors/slow requests are never missed
Q4. Why should the memory_limiter Processor be placed first in the pipeline? To check memory first and prevent OOM when receiving large volumes of data
Q5. How do you check the Collector's self metrics? Via the /metrics endpoint on port 8888 or zPages (port 55679)
Q6. What is the relationship between the batch Processor's timeout and send_batch_size? The batch is sent when either the timeout expires or the send_batch_size is reached (whichever comes first)
Quiz
Q1: What is the main topic covered in "OpenTelemetry Collector Pipeline Design Practical Guide —
Receiver, Processor, Exporter"?
Covers everything from OpenTelemetry Collector architecture to pipeline design, Receiver/Processor/Exporter configuration, and production deployment patterns with practical examples.
Q2: Describe the OTel Collector Architecture.
Pipeline Structure Collector Deployment Patterns
Q3: What are the key steps for Installation?
Kubernetes (Helm) Docker
Q4: What are the key steps for Pipeline Configuration?
Basic Configuration Structure Production Pipeline
Q5: How does Receiver Details work?
OTLP Receiver Filelog Receiver (Log File Collection)