- Published on
OpenTelemetry Collectorパイプライン設計実践ガイド — Receiver、Processor、Exporter
- Authors
- Name
はじめに
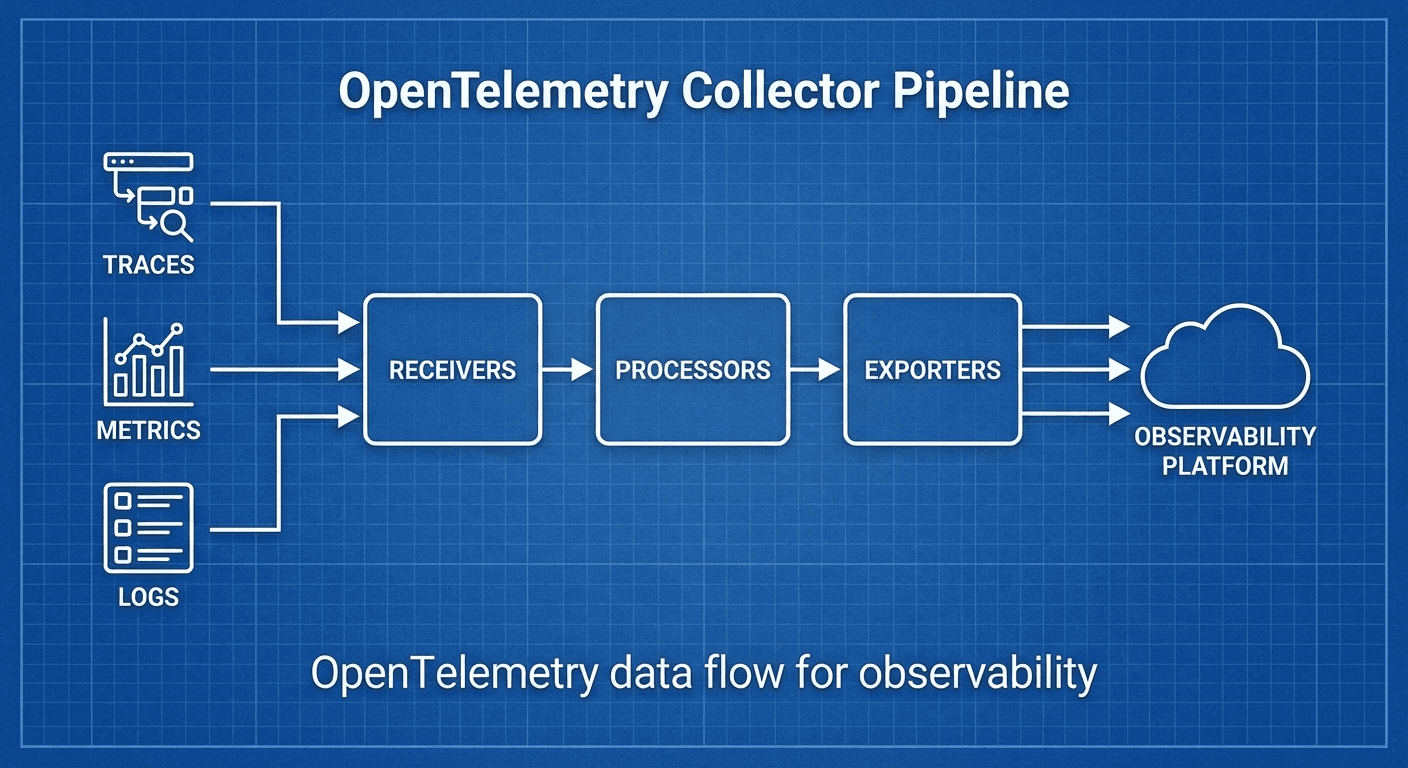
マイクロサービス環境においてTraces、Metrics、Logsを統合的に収集・処理することはObservabilityの核心です。OpenTelemetry Collectorはベンダー中立なテレメトリパイプラインで、さまざまなソースからデータを収集し、任意のバックエンドに送信します。
この記事では、OTel Collectorのアーキテクチャを理解し、プロダクション環境でのパイプライン設計を解説します。
OTel Collectorアーキテクチャ
パイプライン構造
# データフロー
# Receiver → Processor → Exporter
#
# Receiver: データ収集(OTLP、Jaeger、Prometheus、Fluentdなど)
# Processor: データ加工(フィルタリング、変換、バッチング、サンプリング)
# Exporter: データ送信(OTLP、Jaeger、Prometheus、Lokiなど)
#
# 1つのCollectorに複数のパイプラインを構成可能:
# - traces pipeline
# - metrics pipeline
# - logs pipeline
Collectorデプロイパターン
# パターン1: Agent(サイドカー/DaemonSet)
# 各ノード/Podに配置、ローカル収集

# パターン2: Gateway(中央集中)
# クラスター内の独立サービスとして配置、トラフィック集中

# パターン3: Agent + Gateway(推奨)
# Agentがローカル収集 → Gatewayが中央処理/ルーティング
インストール
Kubernetes(Helm)
# OpenTelemetry Operatorインストール
helm repo add open-telemetry https://open-telemetry.github.io/opentelemetry-helm-charts
helm repo update

# Collectorインストール(DaemonSetモード)
helm install otel-collector open-telemetry/opentelemetry-collector \
  --namespace observability \
  --create-namespace \
  --values collector-values.yaml
Docker
docker run -d --name otel-collector \
  -p 4317:4317 \
  -p 4318:4318 \
  -p 8888:8888 \
  -v $(pwd)/otel-collector-config.yaml:/etc/otelcol/config.yaml \
  otel/opentelemetry-collector-contrib:0.96.0
パイプライン設定
基本設定構造
# otel-collector-config.yaml
receivers:
  otlp:
    protocols:
      grpc:
        endpoint: 0.0.0.0:4317
      http:
        endpoint: 0.0.0.0:4318

processors:
  batch:
    timeout: 5s
    send_batch_size: 1000
    send_batch_max_size: 1500

exporters:
  debug:
    verbosity: detailed

service:
  pipelines:
    traces:
      receivers: [otlp]
      processors: [batch]
      exporters: [debug]
    metrics:
      receivers: [otlp]
      processors: [batch]
      exporters: [debug]
    logs:
      receivers: [otlp]
      processors: [batch]
      exporters: [debug]
プロダクションパイプライン
# production-config.yaml
receivers:
  # OTLP(アプリケーションSDKから送信)
  otlp:
    protocols:
      grpc:
        endpoint: 0.0.0.0:4317
        max_recv_msg_size_mib: 4
      http:
        endpoint: 0.0.0.0:4318
        cors:
          allowed_origins: ['*']

  # Prometheusスクレイピング
  prometheus:
    config:
      scrape_configs:
        - job_name: 'kubernetes-pods'
          kubernetes_sd_configs:
            - role: pod
          relabel_configs:
            - source_labels: [__meta_kubernetes_pod_annotation_prometheus_io_scrape]
              action: keep
              regex: true

  # ホストメトリクス
  hostmetrics:
    collection_interval: 30s
    scrapers:
      cpu: {}
      memory: {}
      disk: {}
      network: {}
      load: {}

  # Kubernetesイベント
  k8s_events:
    namespaces: [default, production]

processors:
  # バッチング
  batch:
    timeout: 5s
    send_batch_size: 1000

  # メモリ制限
  memory_limiter:
    check_interval: 1s
    limit_mib: 1500
    spike_limit_mib: 512

  # リソース情報の付加
  resourcedetection:
    detectors: [env, system, docker, gcp, aws, azure]
    timeout: 5s

  # K8sメタデータの付加
  k8sattributes:
    auth_type: serviceAccount
    extract:
      metadata:
        - k8s.namespace.name
        - k8s.deployment.name
        - k8s.pod.name
        - k8s.node.name

  # 不要な属性の削除
  attributes:
    actions:
      - key: http.request.header.authorization
        action: delete
      - key: db.statement
        action: hash # 機密クエリのハッシュ化

  # テールサンプリング(tracesのみ)
  tail_sampling:
    decision_wait: 10s
    num_traces: 100000
    policies:
      - name: error-policy
        type: status_code
        status_code:
          status_codes: [ERROR]
      - name: slow-policy
        type: latency
        latency:
          threshold_ms: 1000
      - name: probabilistic-policy
        type: probabilistic
        probabilistic:
          sampling_percentage: 10

  # フィルタリング
  filter:
    metrics:
      exclude:
        match_type: regexp
        metric_names:
          - 'go_.*'
          - 'process_.*'

exporters:
  # Traces → Tempo
  otlp/tempo:
    endpoint: tempo.observability.svc:4317
    tls:
      insecure: true

  # Metrics → Prometheus/Mimir
  prometheusremotewrite:
    endpoint: http://mimir.observability.svc:9009/api/v1/push
    tls:
      insecure: true
    resource_to_telemetry_conversion:
      enabled: true

  # Logs → Loki
  loki:
    endpoint: http://loki.observability.svc:3100/loki/api/v1/push
    default_labels_enabled:
      exporter: true
      job: true

  # デバッグ(トラブルシューティング用)
  debug:
    verbosity: basic

extensions:
  # ヘルスチェック
  health_check:
    endpoint: 0.0.0.0:13133

  # 自己メトリクス
  zpages:
    endpoint: 0.0.0.0:55679

  # pprof(プロファイリング)
  pprof:
    endpoint: 0.0.0.0:1777

service:
  extensions: [health_check, zpages, pprof]

  pipelines:
    traces:
      receivers: [otlp]
      processors:
        [memory_limiter, resourcedetection, k8sattributes, attributes, tail_sampling, batch]
      exporters: [otlp/tempo]

    metrics:
      receivers: [otlp, prometheus, hostmetrics]
      processors: [memory_limiter, resourcedetection, k8sattributes, filter, batch]
      exporters: [prometheusremotewrite]

    logs:
      receivers: [otlp, k8s_events]
      processors: [memory_limiter, resourcedetection, k8sattributes, attributes, batch]
      exporters: [loki]

  telemetry:
    logs:
      level: info
    metrics:
      address: 0.0.0.0:8888
Receiver詳細
OTLP Receiver
receivers:
  otlp:
    protocols:
      grpc:
        endpoint: 0.0.0.0:4317
        max_recv_msg_size_mib: 4
        keepalive:
          server_parameters:
            max_connection_idle: 11s
            max_connection_age: 30s
      http:
        endpoint: 0.0.0.0:4318
Filelog Receiver(ログファイル収集)
receivers:
  filelog:
    include:
      - /var/log/pods/*/*/*.log
    exclude:
      - /var/log/pods/*/otel-collector*/*.log
    start_at: beginning
    include_file_path: true
    operators:
      - type: router
        routes:
          - output: parse_json
            expr: 'body matches "^\\{"'
          - output: parse_plain
            expr: 'body matches "^[^{]"'
      - id: parse_json
        type: json_parser
        timestamp:
          parse_from: attributes.timestamp
          layout: '%Y-%m-%dT%H:%M:%S.%fZ'
      - id: parse_plain
        type: regex_parser
        regex: '^(?P<timestamp>\S+) (?P<level>\S+) (?P<message>.*)'
Processor詳細
テールサンプリング(重要!)
processors:
  tail_sampling:
    decision_wait: 10s
    num_traces: 100000
    expected_new_traces_per_sec: 1000
    policies:
      # エラーは100%収集
      - name: errors
        type: status_code
        status_code:
          status_codes: [ERROR]

      # 1秒以上遅いリクエストは100%収集
      - name: slow-traces
        type: latency
        latency:
          threshold_ms: 1000

      # 特定サービスは100%収集
      - name: critical-services
        type: string_attribute
        string_attribute:
          key: service.name
          values: [payment-service, auth-service]

      # 残りは5%のみ収集
      - name: probabilistic
        type: probabilistic
        probabilistic:
          sampling_percentage: 5

      # 複合ポリシー
      - name: composite-policy
        type: composite
        composite:
          max_total_spans_per_second: 1000
          policy_order: [errors, slow-traces, critical-services, probabilistic]
          rate_allocation:
            - policy: errors
              percent: 30
            - policy: slow-traces
              percent: 30
            - policy: critical-services
              percent: 20
            - policy: probabilistic
              percent: 20
Transform Processor
processors:
  transform:
    trace_statements:
      - context: span
        statements:
          # 属性の追加
          - set(attributes["deployment.environment"], "production")
          # 属性の変換
          - replace_pattern(attributes["http.url"], "password=\\w+", "password=***")
          # 条件付き処理
          - set(attributes["error.category"], "timeout") where attributes["error.type"] == "DeadlineExceeded"

    metric_statements:
      - context: datapoint
        statements:
          - set(attributes["env"], "prod")

    log_statements:
      - context: log
        statements:
          # ログ本文から情報を抽出
          - set(attributes["user_id"], ExtractPatterns(body, "user_id=(?P<user_id>\\w+)"))
Kubernetesデプロイ
Agent(DaemonSet)+ Gatewayパターン
# agent-config.yaml(DaemonSet)
apiVersion: opentelemetry.io/v1beta1
kind: OpenTelemetryCollector
metadata:
  name: otel-agent
  namespace: observability
spec:
  mode: daemonset
  config:
    receivers:
      otlp:
        protocols:
          grpc:
            endpoint: 0.0.0.0:4317
      hostmetrics:
        collection_interval: 30s
        scrapers:
          cpu: {}
          memory: {}

    processors:
      memory_limiter:
        limit_mib: 512
      batch:
        timeout: 5s

    exporters:
      # Gatewayへ送信
      otlp:
        endpoint: otel-gateway.observability.svc:4317
        tls:
          insecure: true

    service:
      pipelines:
        traces:
          receivers: [otlp]
          processors: [memory_limiter, batch]
          exporters: [otlp]
        metrics:
          receivers: [otlp, hostmetrics]
          processors: [memory_limiter, batch]
          exporters: [otlp]
---
# gateway-config.yaml(Deployment)
apiVersion: opentelemetry.io/v1beta1
kind: OpenTelemetryCollector
metadata:
  name: otel-gateway
  namespace: observability
spec:
  mode: deployment
  replicas: 3
  config:
    receivers:
      otlp:
        protocols:
          grpc:
            endpoint: 0.0.0.0:4317

    processors:
      memory_limiter:
        limit_mib: 2048
      tail_sampling:
        decision_wait: 10s
        policies:
          - name: errors
            type: status_code
            status_code:
              status_codes: [ERROR]
          - name: probabilistic
            type: probabilistic
            probabilistic:
              sampling_percentage: 10
      batch:
        timeout: 10s
        send_batch_size: 5000

    exporters:
      otlp/tempo:
        endpoint: tempo.observability.svc:4317
        tls:
          insecure: true
      prometheusremotewrite:
        endpoint: http://mimir.observability.svc:9009/api/v1/push
      loki:
        endpoint: http://loki.observability.svc:3100/loki/api/v1/push

    service:
      pipelines:
        traces:
          receivers: [otlp]
          processors: [memory_limiter, tail_sampling, batch]
          exporters: [otlp/tempo]
        metrics:
          receivers: [otlp]
          processors: [memory_limiter, batch]
          exporters: [prometheusremotewrite]
        logs:
          receivers: [otlp]
          processors: [memory_limiter, batch]
          exporters: [loki]
トラブルシューティング
自己メトリクスの確認
# Collector自己メトリクス(ポート8888)
curl http://localhost:8888/metrics | grep otelcol

# 主要メトリクス:
# otelcol_receiver_accepted_spans - 受信されたspan数
# otelcol_receiver_refused_spans - 拒否されたspan数
# otelcol_processor_dropped_spans - ドロップされたspan数
# otelcol_exporter_sent_spans - 送信されたspan数
# otelcol_exporter_send_failed_spans - 送信失敗span数
zPagesによるデバッグ
# http://localhost:55679/debug/tracez — 最近のtrace確認
# http://localhost:55679/debug/pipelinez — パイプラインステータス
まとめ
OpenTelemetry Collectorパイプライン設計の要点:
- Agent + Gatewayパターン:ローカル収集+中央処理で効率的な運用
- テールサンプリング:エラー/遅いリクエストは100%、残りは確率的サンプリングでコスト削減
- Memory Limiterは必須:OOM防止のためのメモリ制限
- Processorの順序が重要:memory_limiter → sampling → batch の順序を推奨
- ベンダー中立:バックエンド変更時はExporterのみ交換
クイズ(6問)
Q1. OTel Collectorパイプラインの3つの構成要素は? Receiver、Processor、Exporter
Q2. Agent + Gatewayパターンでのそれぞれの役割は? Agent:各ノードでのローカル収集、Gateway:中央での処理/ルーティング/送信
Q3. テールサンプリングがヘッドサンプリングより優れている理由は? トレース全体を確認してからサンプリング判断するため、エラー/遅いリクエストを見逃さない
Q4. memory_limiter Processorをパイプラインの最初に配置する理由は? 受信データが多い場合にOOMを防止するため、最初にメモリをチェック
Q5. Collectorの自己メトリクスを確認する方法は? ポート8888の/metricsエンドポイントまたはzPages(ポート55679)
Q6. batch Processorのtimeoutとsend_batch_sizeの関係は? timeout時間に到達するかsend_batch_sizeに到達した場合にバッチを送信(先に発生した条件)