- Authors
- Name
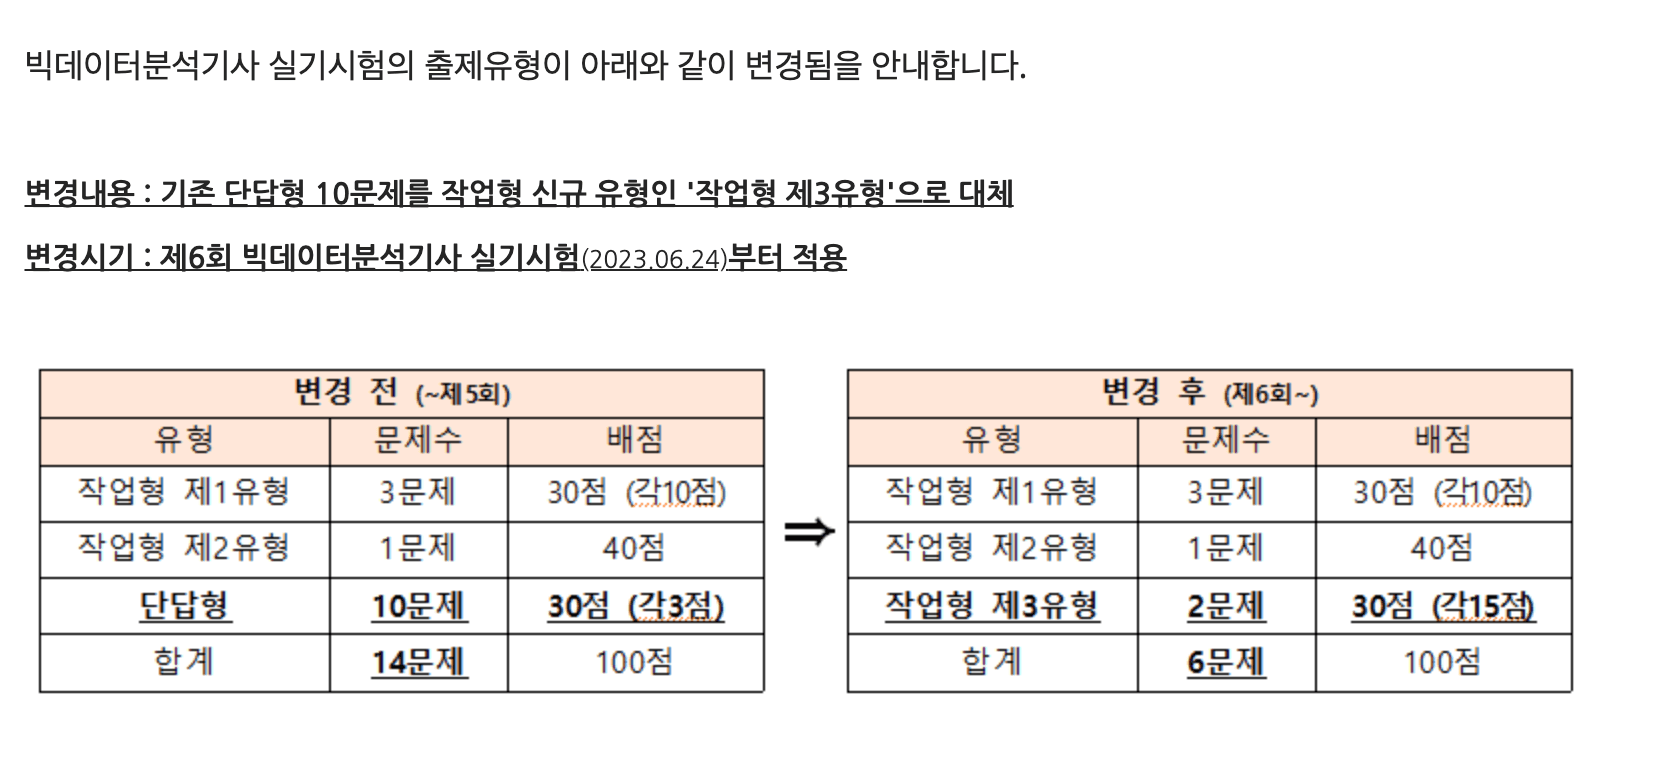
I am organizing what I studied while preparing for the 6th Big Data Analytics Engineer practical exam to be held on June 24, 2023. In this 6th exam, the existing short-answer questions have been removed and Task Type 3 has been added. Since it has been almost two years since I last worked with machine learning, I want to review the material. Task Types 1 and 2 have established patterns and should not be too difficult, but Task Type 3 is expected to be more challenging as it also tests statistical knowledge.
For practical exam preparation, I referenced many videos from After Work Side Projects on YouTube, and the practice problems posted on their Kaggle page, which were very helpful.
Task Type 1
Since this tests basic data manipulation skills, it is relatively easier compared to other types. However, since no IDE is provided, it seems necessary to review library usage and DataFrame syntax. Here is a summary of commands needed from previous exams.
# When reading csv data
import pandas as pd
train = pd.read_csv("data/train .csv")

# Checking basic statistics
train.head() # View partial data
train.describe() # Check mean, standard deviation, quartile values
train.describe(include="object") # Check basic data for categorical variables (At this point, you should verify whether the unique values of categorical variables in train match those in test. If they differ, Label Encoding must be done on the combined train and test data.)

train.isnull().sum() # Check for missing values

# Implementing minmax scaler manually
def minmax(data):
    data = (data-min(data))/(max(data)- min(data))
    return data

# When applying minmax scaler to the numeric variable qsec,
train['qsec'] = minmax(train['qsec'])

# Using sklearn minmax scaler
from sklearn.preprocessing import minmax_scale
qsec_scaled = minmax_scale(train['scale'])

# Number of rows where 'qsec' is 0.5 or greater
sum(qsec_scaled >0.5) # Sum of True values
len(train[qsec_scaled >0.5]) # Length of data

# Getting standard deviation of age column
age_std = train['age'].std()

# Filling missing values in f1 column with median
train['f1'] = train['f1'].fillna(train['f1'].median())

# Using only the first 70% of data
df = df.iloc[:int(len(df)*0.7),:]

# Multiple column filter conditions
# Sum of outliers in age column. Outliers are defined as values beyond 'standard deviation * 1.5' from the mean.
age = train['age']
age_outliers = age[ ((age < age.mean()-age.std()*1.5) | (age > age.mean()+age.std()*1.5))]
age_outliers.sum()

# Index-based sort
train.sort_index(ascending=True) # Ascending order
train.sort_index(ascending=False) # Descending order

# Value-based sort. Sort by age in descending order
sorted_train = train.sort_values(by=['age'], ascending=False)

# Accessing a data frame with iloc.
# Update the last column of the first 10 rows with the minimum value of 'f5' column from those 10 rows
df.iloc[:10, -1] = df['f5'][:10].min()


# Calculate the absolute difference between Q3 and Q1 of the age column, truncate decimals and output as integer
ans = int(abs(df['age'].quantile(0.25) - df['age'].quantile(0.75)))

# Changing column type
submission['Segmentation'] = submission['Segmentation'].astype(int)
Task Type 2
Task Type 2 involves supervised learning, with either Classification or Regression tasks. The somewhat tedious part is that features contain a mix of numerical and categorical variables, and the key is to preprocess them appropriately before training the model. To improve performance, you can tune hyperparameters or handle outliers and missing values. (This seems optional when time permits.) It is important to submit results in the exact specified format. Choosing a tree-based model (RandomForest) that does not require scaling of numerical variables and delivers decent performance seems advantageous for saving time.
The overall task flow for solving Task Type 2 is as follows:
- Data EDA (check variable types, basic statistics, outliers and missing values, target variable)
- Data preprocessing (encode categorical variables, handle missing values, split train/valid datasets)
- Create, train, and evaluate the model
- Submit answers for test data
# EDA
import pandas as pd
# Read data
df = pd.read_csv("train.csv")
# Check data dimensions
print(df.shape)
# Check for missing values
print(df.isnull().sum())
# Check basic statistics
print(df.describe())

# Data preprocessing
df['age'] = df['age'].fillna(df['age'].median())
# Extract target column from data
target = df.pop('target')

# Label Encoding (encoding categorical variables)
from sklearn.preprocessing import LabelEncoder
cols = df['aa', 'bb'] # Categorical variables
for col in cols:
    le = LabelEncoder()
    df[col] = le.fit_transform(df[col])
    X_test[col] = le.transform(X_test[col])
print(df.head())

from sklearn.ensemble import RandomForestClassifier
model = RandomForestClassifier()
model.fit(df, target)
print(model.score(df, target))
predictions = model.predict_proba(X_test)

# Make sure you know the scoring metrics well.
Task Type 3
For Task Type 3, I could not predict what problems would appear, so I did some research. Based on a video uploaded by "Smart Statistics Life" on YouTube, I plan to memorize how to implement the following statistical measures in Python.
- Z-test
- T-test
- One-sample
- Two-sample
- When variances of two groups are equal
- When variances of two groups are different
- Paired t-test
- Chi-square test
- ANOVA
import pandas as pd
from scipy import stats
a = pd.read_csv('data/blood_pressure.csv', index_col=0)

# print(a.shape)
# print(a.head())

a['diff'] = a['bp_after'] - a['bp_before']
#1
print(round(a['diff'].mean(),2))

#2
st , pv = stats.ttest_rel(a['bp_after'], a['bp_before'], alternative='less')

print(round(st,4))


#3
print(round(pv,4))