- Authors
- Name
Background
Async Profilerという、Javaアプリケーションに大きな影響を与えずにランタイムでどの関数やどの呼び出しが行われているかを調査できるソフトウェアを紹介したいと思う。
Install
 wget https://github.com/jvm-profiling-tools/async-profiler/releases/download/v2.9/async-profiler-2.9-linux-x64.tar.gz

 tar -zxvf async-profiler-2.9-linux-x64.tar.gz
Execute
$./profiler.sh
Usage: ./profiler.sh [action] [options] <pid>
Actions:
start start profiling and return immediately
resume resume profiling without resetting collected data
stop stop profiling
dump dump collected data without stopping profiling session
check check if the specified profiling event is available
status print profiling status
meminfo print profiler memory stats
list list profiling events supported by the target JVM
collect collect profile for the specified period of time
and then stop (default action)
Options:
-e event profiling event: cpu|alloc|lock|cache-misses etc.
-d duration run profiling for <duration> seconds
-f filename dump output to <filename>
-i interval sampling interval in nanoseconds
-j jstackdepth maximum Java stack depth
-t profile different threads separately
-s simple class names instead of FQN
-g print method signatures
-a annotate Java methods
-l prepend library names
-o fmt output format: flat|traces|collapsed|flamegraph|tree|jfr
-I include output only stack traces containing the specified pattern
-X exclude exclude stack traces with the specified pattern
-v, --version display version string
--title string FlameGraph title
--minwidth pct skip frames smaller than pct%
--reverse generate stack-reversed FlameGraph / Call tree
--loop time run profiler in a loop
--alloc bytes allocation profiling interval in bytes
--live build allocation profile from live objects only
--lock duration lock profiling threshold in nanoseconds
--total accumulate the total value (time, bytes, etc.)
--all-user only include user-mode events
--sched group threads by scheduling policy
--cstack mode how to traverse C stack: fp|dwarf|lbr|no
--begin function begin profiling when function is executed
--end function end profiling when function is executed
--ttsp time-to-safepoint profiling
--jfrsync config synchronize profiler with JFR recording
--lib path full path to libasyncProfiler.so in the container
--fdtransfer use fdtransfer to serve perf requests
from the non-privileged target
<pid> is a numeric process ID of the target JVM
or 'jps' keyword to find running JVM automatically
or the application's name as it would appear in the jps tool
Example: ./profiler.sh -d 30 -f profile.html 3456
./profiler.sh start -i 999000 jps
./profiler.sh stop -o flat jps
./profiler.sh -d 5 -e alloc MyAppName
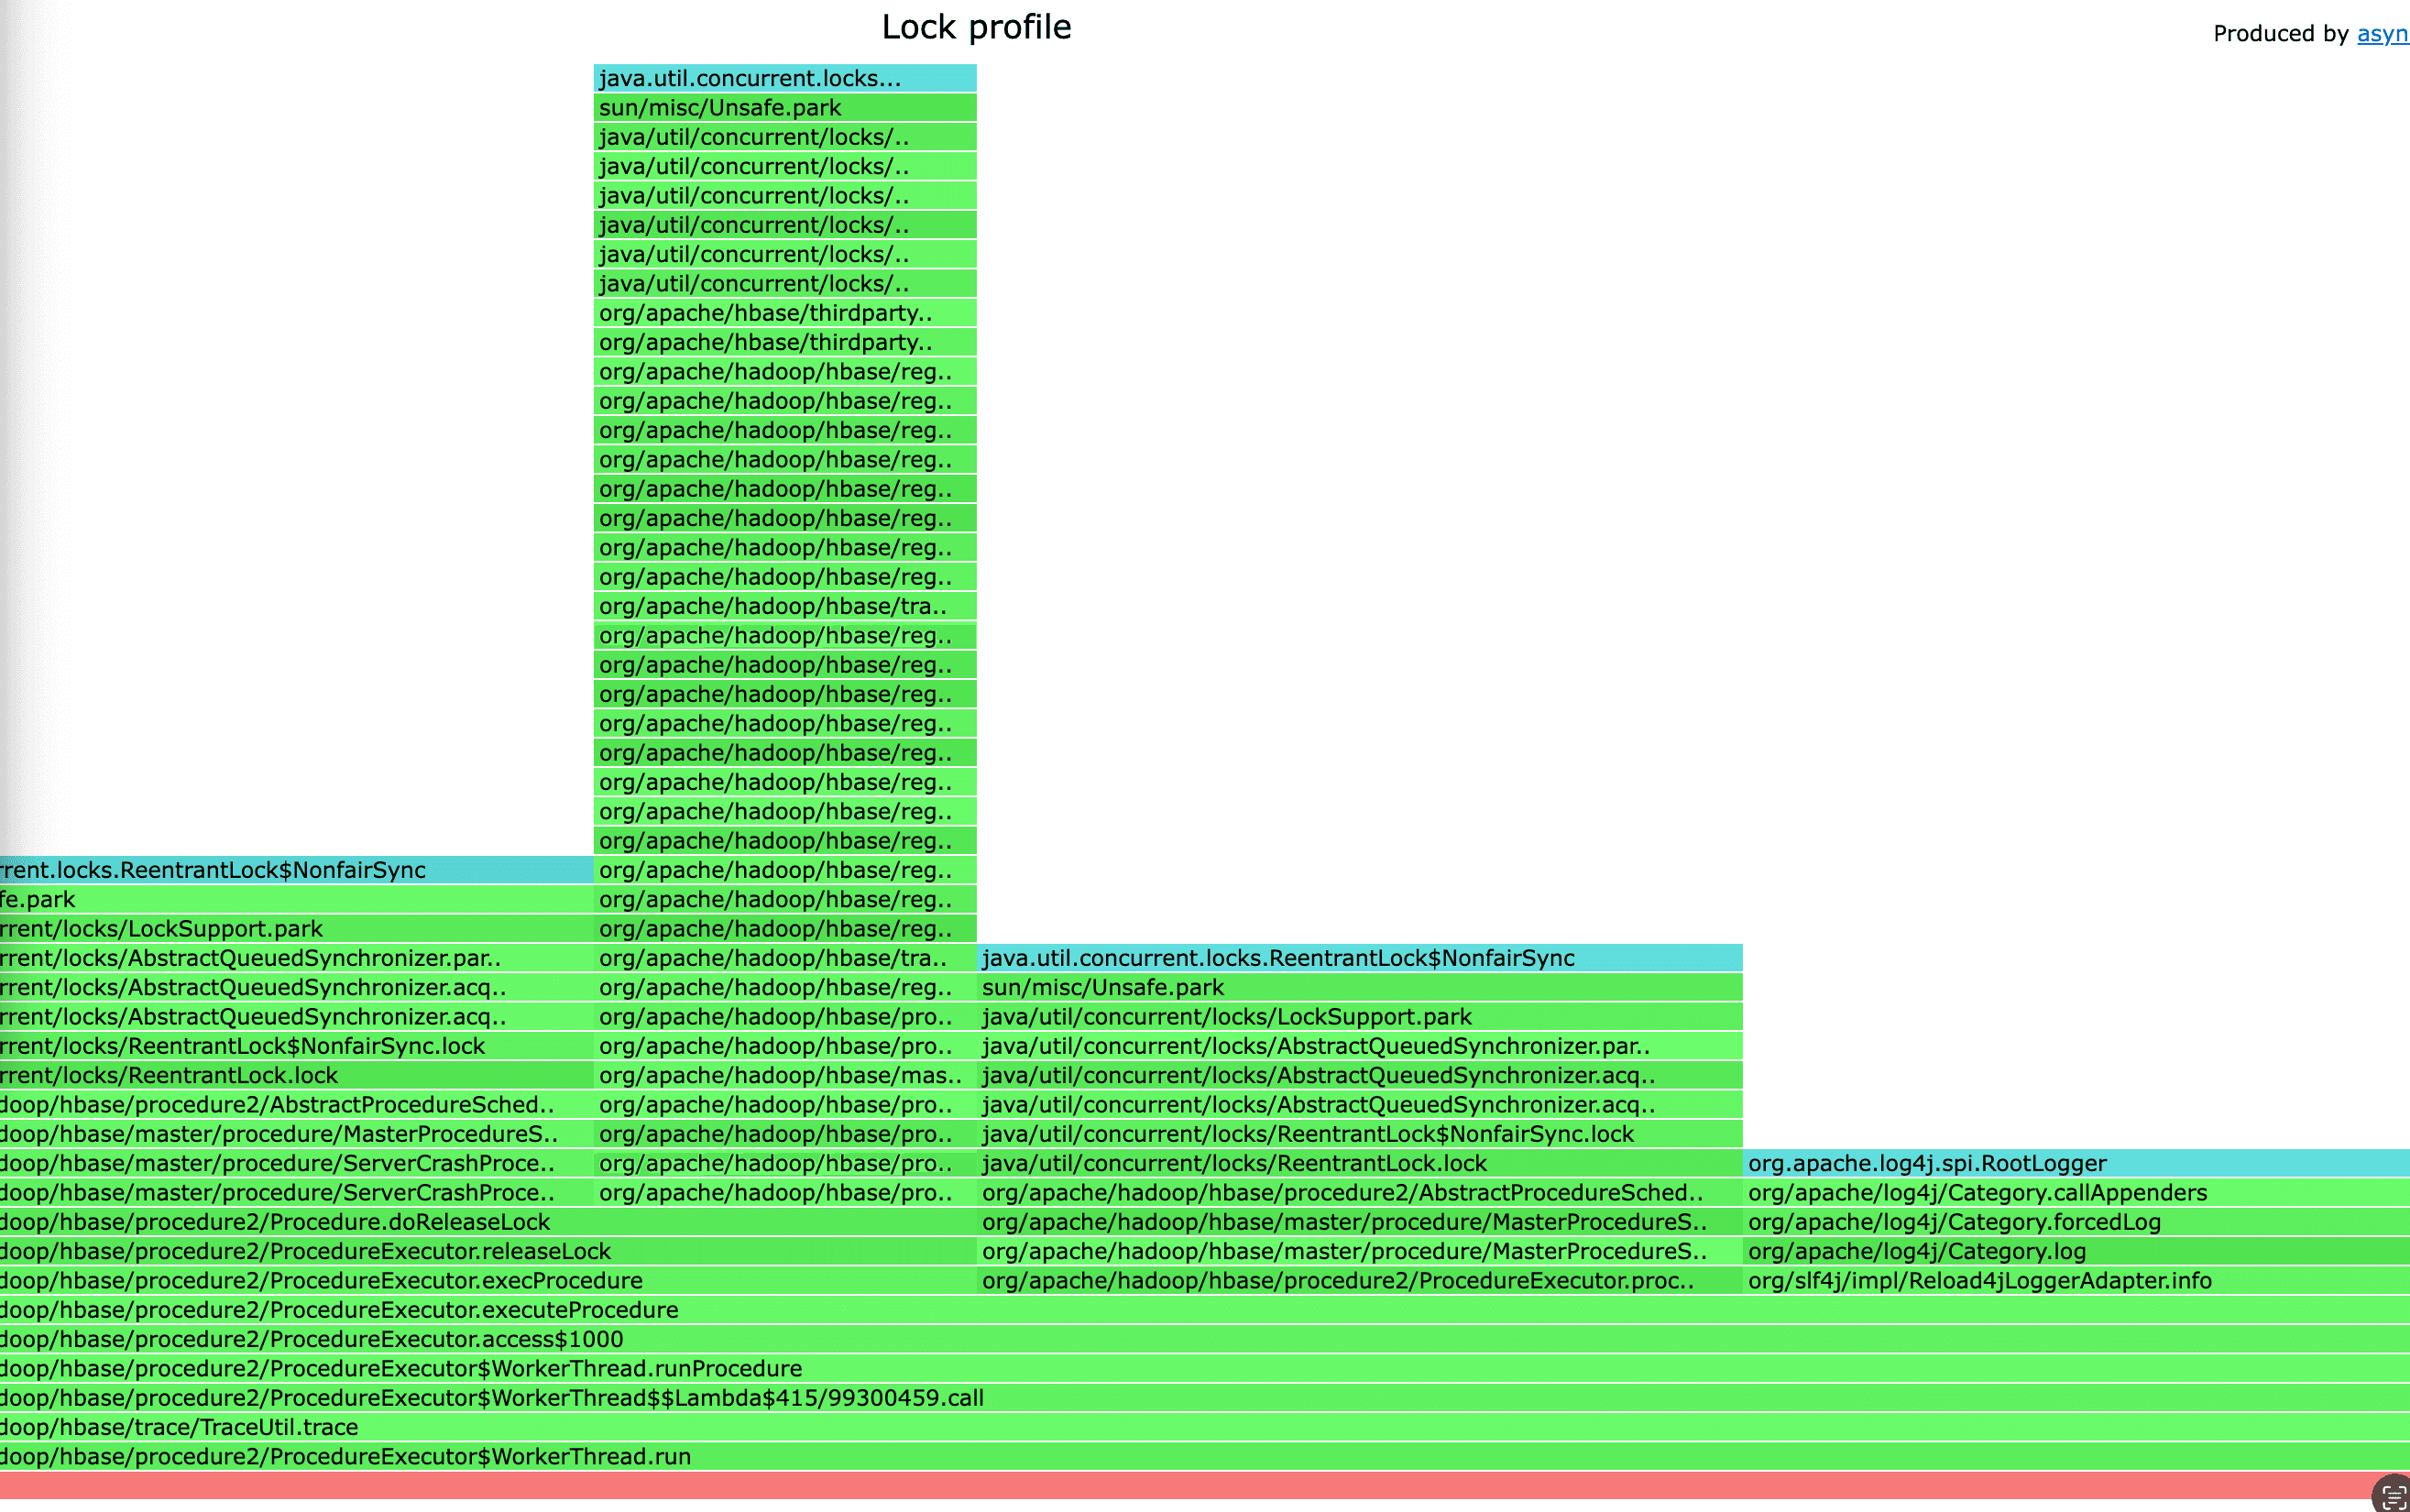
$ ./profiler.sh -e lock -d 10 -o flamegraph -f flamegraph.html 1245729
結果の確認
保存したflamegraph.htmlがあるディレクトリでpython3 -m http.serverのような一時サーバーを立ち上げて外部からアクセスできるようにすると、以下のようにWeb UIを通じてプロファイリング結果を確認できる。